
Note the unusual memory limit for this problem.
Inspired by Carlo's success, Alessandro has decided to start his own software company in the mountains. However, unlike Carlo, he settled in a city where the weather is highly unpredictable.
Initially, the entire city is dry, but over the course of days, rainfall and droughts will continuously change its conditions.
The city is represented as an grid, with cells indexed from to .
On day (), a rectangular region of the grid undergoes a weather change. Given integers , , , , all cells satisfying:
will switch their state -- wet cells become dry, and dry cells become wet.
At the end of each day, Alessandro wonders: What is the total perimeter of the wet regions? Unfortunately, he struggles to find this value. Can you help him determine the perimeter after each day's changes?
Input data
The input file consists of:
- item a line containing integers , , : and represent the size of the city, represents the number of days.
- item lines, with line consisting of integers , , , , representing the rectangular area that will change on day .
Output data
The output file must contain a single line consisting of the integers .
Constraints and clarifications
- .
- .
- .
- and for each .
| # | Points | Constraints |
|---|---|---|
| 1 | 0 | Examples |
| 2 | 9 | , . |
| 3 | 33 | , . |
| 4 | 25 | . |
| 5 | 33 | No additional constraints. |
Example
stdin
4 5 4
1 2 3 4
2 3 4 5
1 4 2 5
1 4 3 5
stdout
8
16
24
22
Explanation
In the first sample case the city is represented as a grid, with being in the bottom left corner.
In the following figures, at the end of each day, the wet cells will be colored in blue, a red line will mark the perimeter of the wet regions, and a dashed black line will outline the region affected by a weather change.
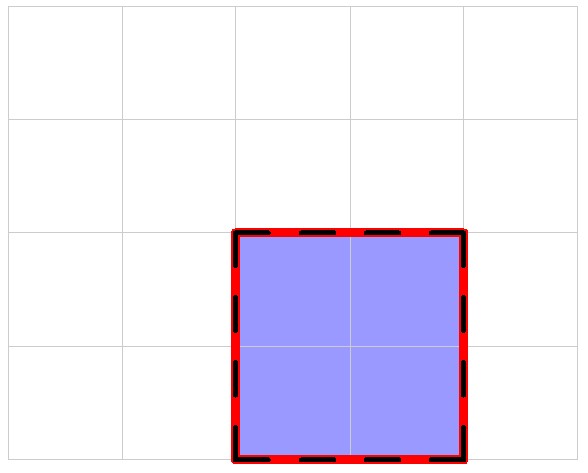
At the end of the first day, the total length of the perimeter is .
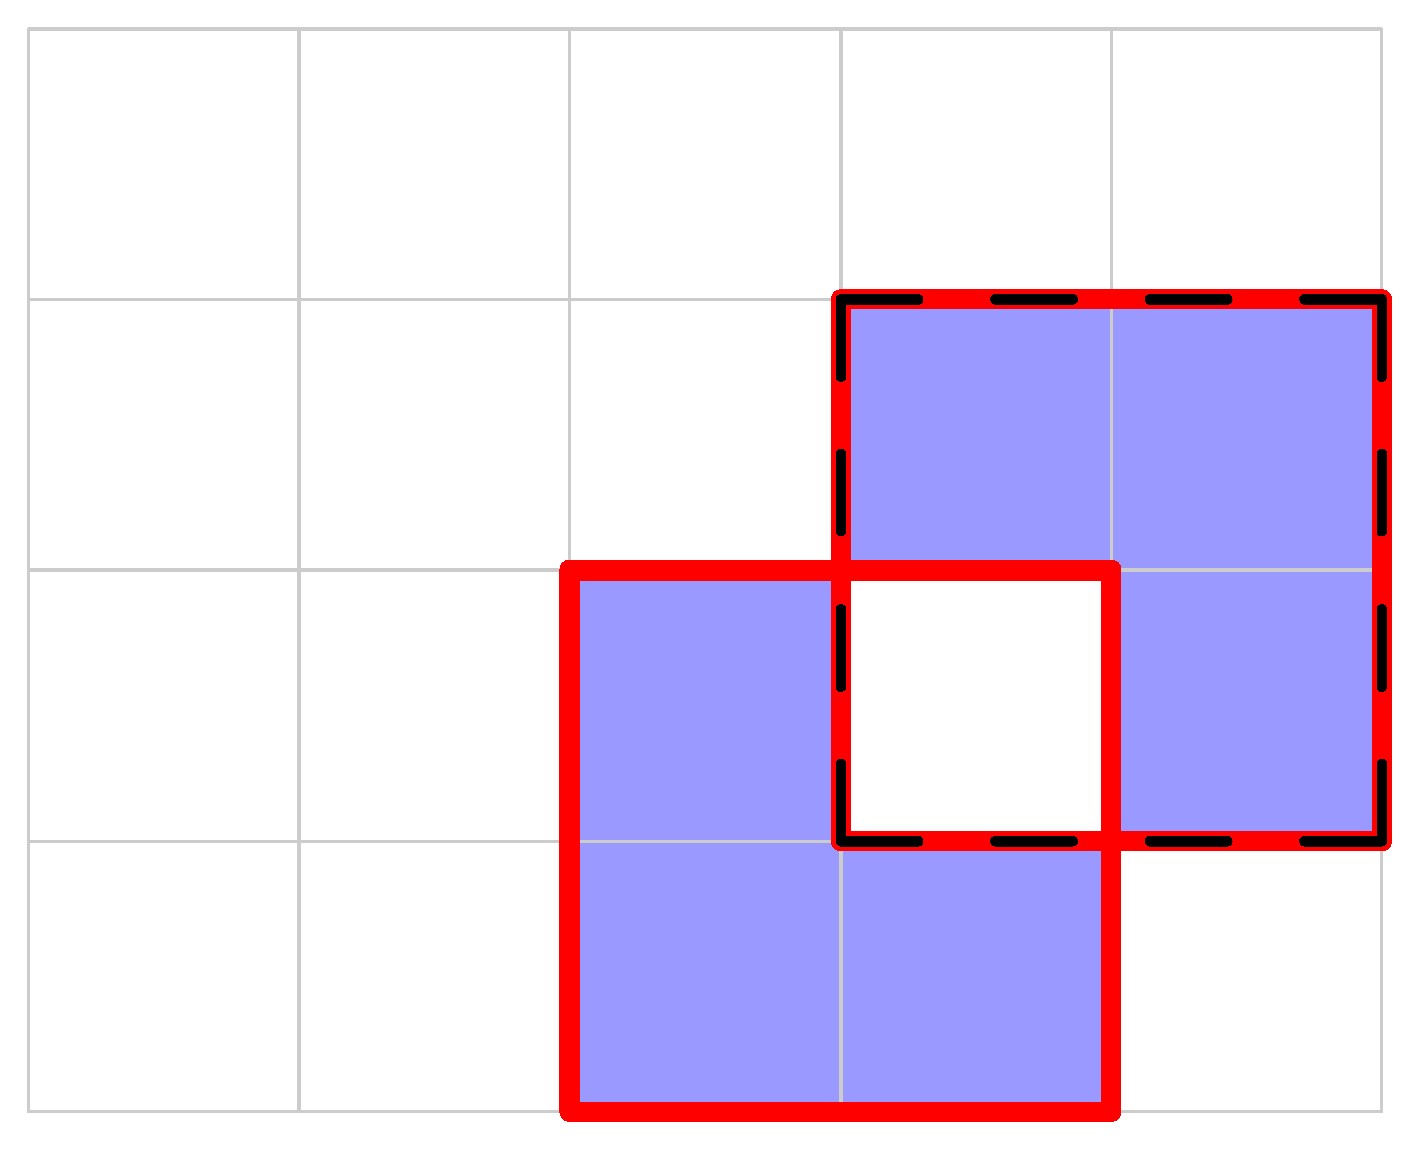
At the end of the second day, the total length of the perimeter is .
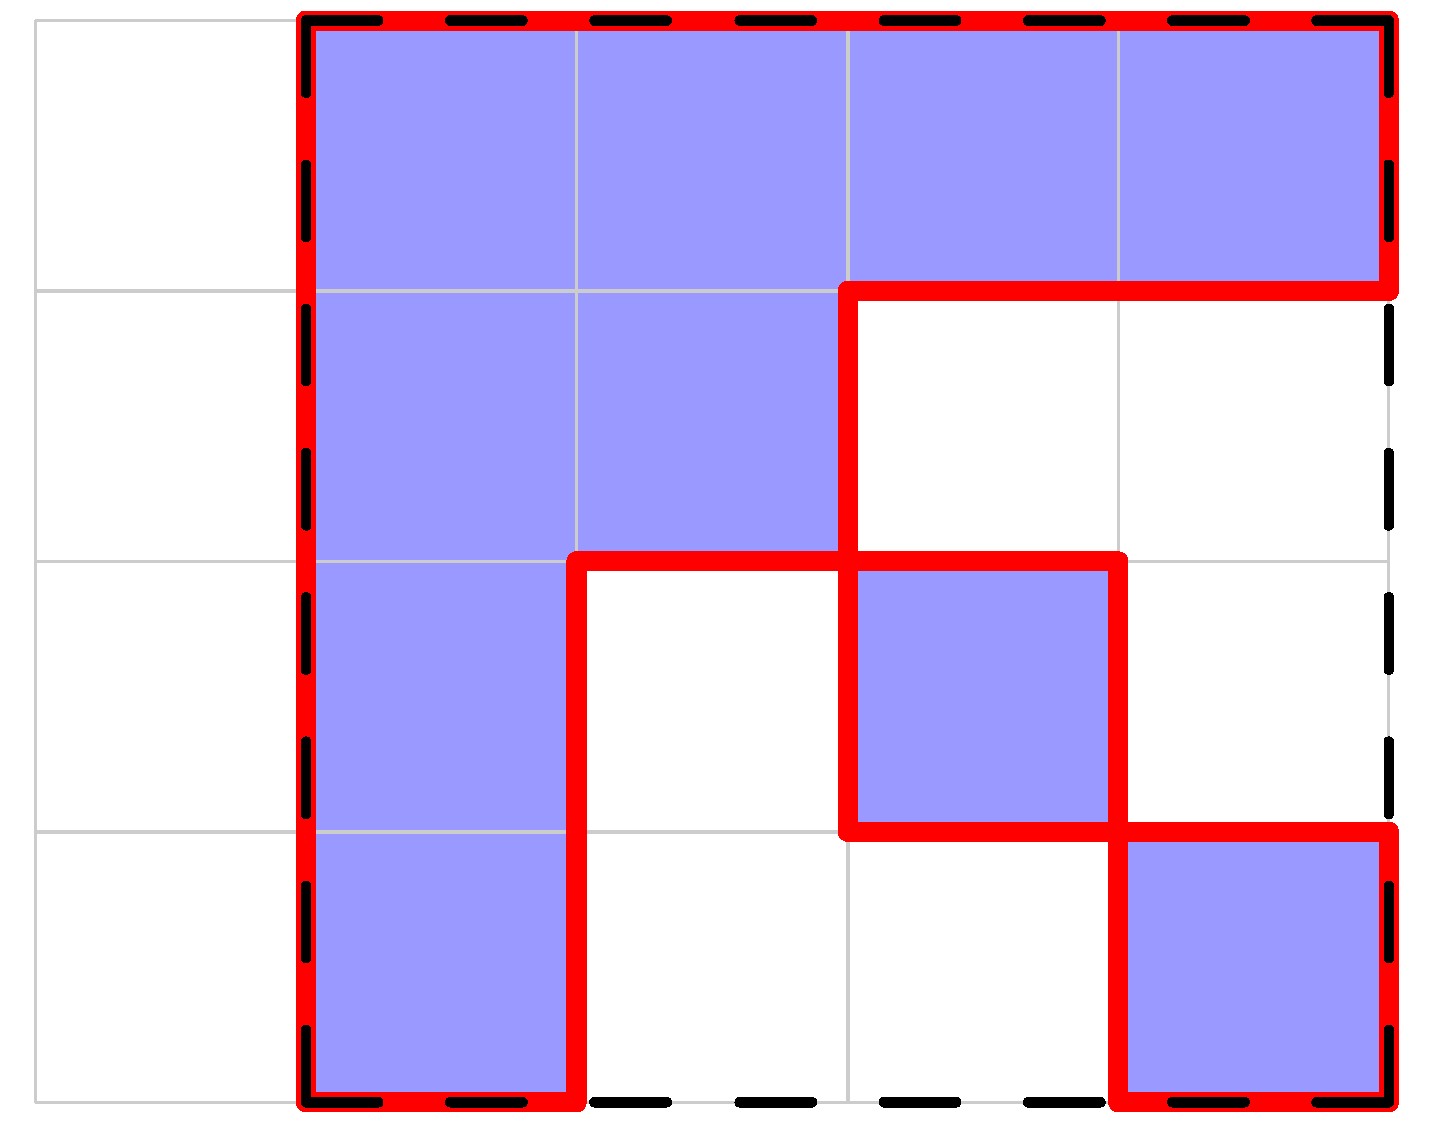
At the end of the third day, the total length of the perimeter is .
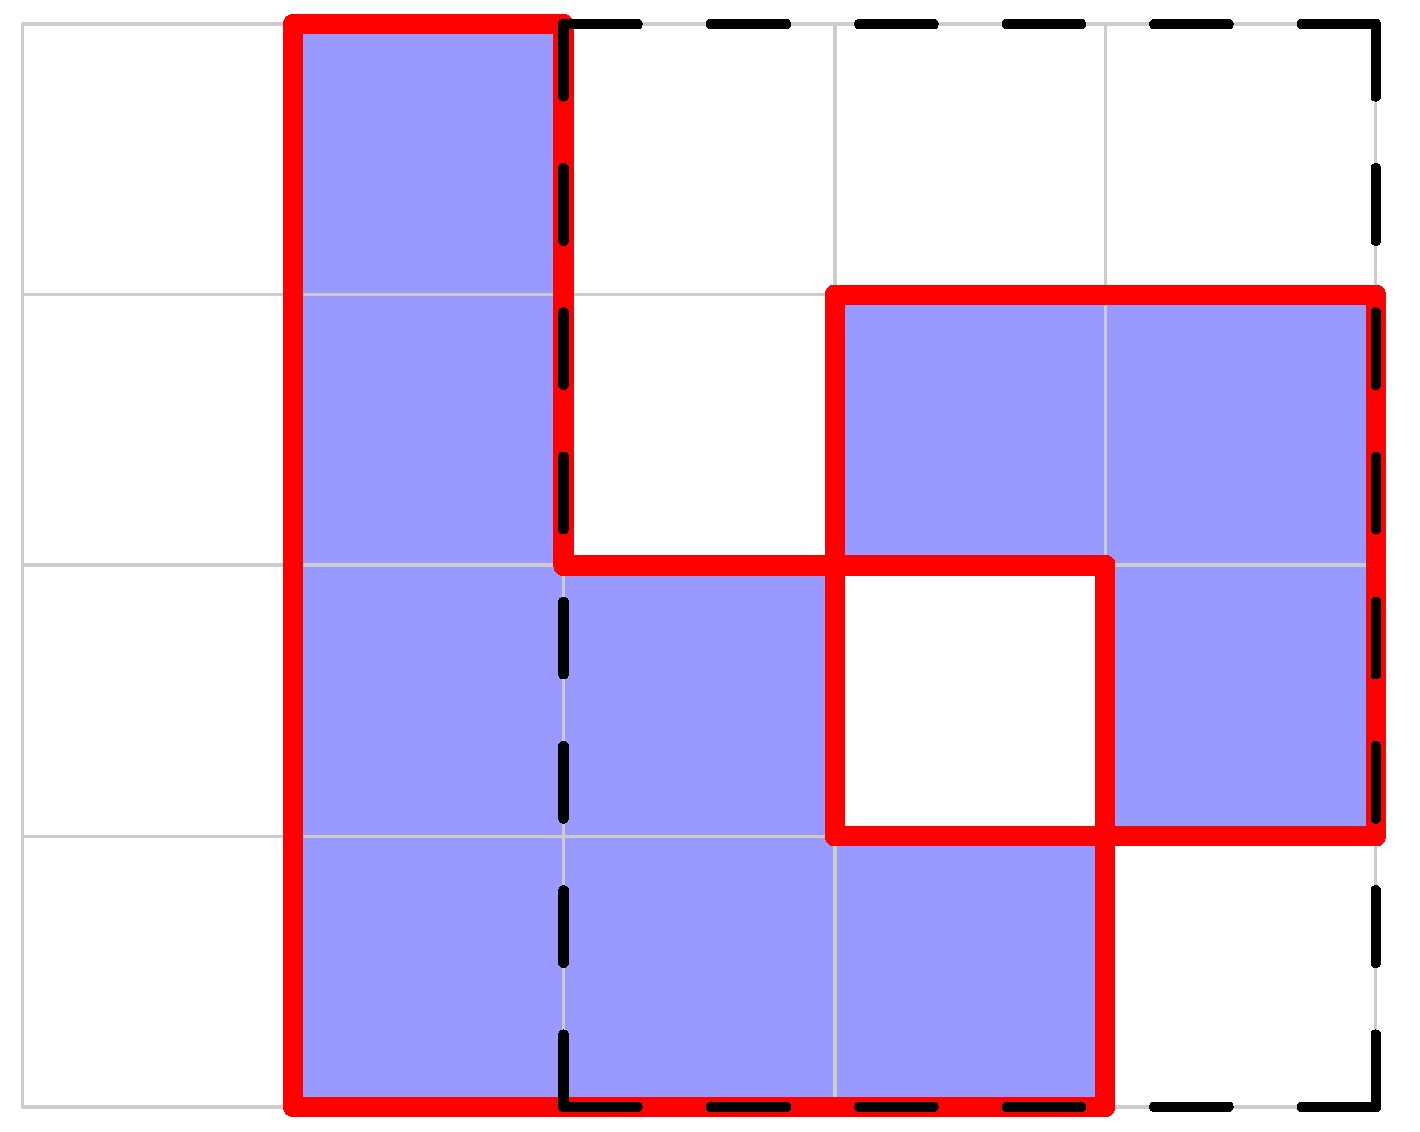
At the end of the fourth day, the total length of the perimeter is .